Wednesday November 4, 2015 at 3:09pm
[CODEBLOCK-94]
This blog explains how we can use SOLIDWORKS Flow Simulation to examine the effects of Downforce and Drag in Motorsport
DRS was first introduced into motorsport through Formula 1
in 2011, the system has rapidly spread through other forms of motorsport as a
way of increasing the overtaking opportunities and making cars more efficient
in straight lines, using less fuel, saving tyre wear etc. What are the actual
effects of DRS in terms of Down Force and Drag on the cars themselves though?
At the Mexico GP in 2015 the Formula 1 cars reached speeds in excess of 200mph
and at those speeds the cars are supposed to be able to create more downforce
than the car weighs itself. With SOLIDWORKS Flow Simulation we can find out
what those effects are.
To determine the difference between DRS being enabled and
disabled two studies will have to be ran so the following presumptions had to
be made:
- The speed of the cars as 200mph
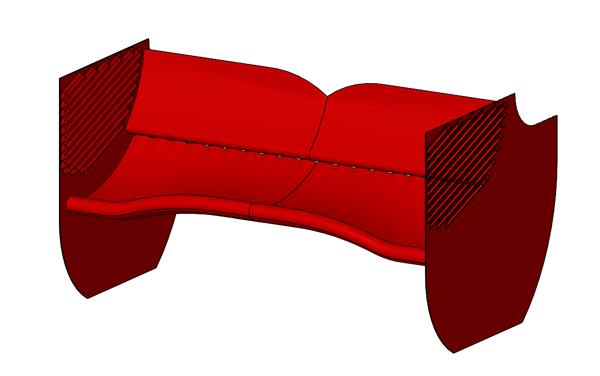
- The design of the rear wing
- The angle at which the wing opens when DRS is
enabled as 50 degrees.

Two configurations can be made from one assembly, by
rotating the upper element of the rear wing and angling it in an upward
direction of 50 degrees we can emulate the mechanism of the DRS being enabled.

Because two studies need to be ran and the type of flow will
be external, a computational domain must be created around the assembly and
must be kept constant between the different studies. Keeping those constant
will allow data to be compared accurately.

Air needs to be added to the studies and a velocity with a
direction for that air flow to simulate the movement of the car, in this case
the velocity was in the –Z direction at 200mph to simulate the car moving in
the Z direction.

Inserting global goals will track the Down Force and Drag
level, using the Normal Forces Y and Z they will be able to give those values
for the whole study.

Below are two images showing the results of the studies
after being ran and showing cut plots though the centres of each one. On show
are the velocity plots, they differ quite a bit.
| DRS Disabled | | DRS Enabled |
| | | |
 | |  |
At this point we can now look at the Down Force and Drag
levels of each study. This is taken from the global goals. The force in Y will
show the Down Force and the Force in Z will show the Drag force acting on the
wing. The values come in Newton’s but can be converted into Kilogram Force. The
values should also be a minus value because of the orientation of the assembly
in regards to the XYZ coordinates.
| Force In Y (N) | Force In Y (Kg.f) | Force in Z (N) | Force In Z (Kg.f) |
| DRS Disabled | 5880 | 599.6 | 3304 | 337 |
| DRS Enabled | 2449 | 249.7 | 1008 | 102.7 |
When DRS is disabled the wing produces 599.6kg.f of Down
Force and 337kg.f of Drag, but when the DRS is enabled the wing only produces
249.7kg.f of Down force and 102.7kg.f of Drag. This is a 58% decrease in Down
Force and a 69% decrease in Drag when the DRS is enabled at 200mph.
This makes it easy to see why the drivers can create more
overtaking opportunities when the aerodynamic package can reduce drag by this
much.
By
David Robertson
Applications Engineer